Analytics Beta Dashboard Overview
The MacroHealth Analytics Beta dashboard allows navigating from one report to the other. The flowing page provides details to help get familiarized with the different sections of Analytics Beta.
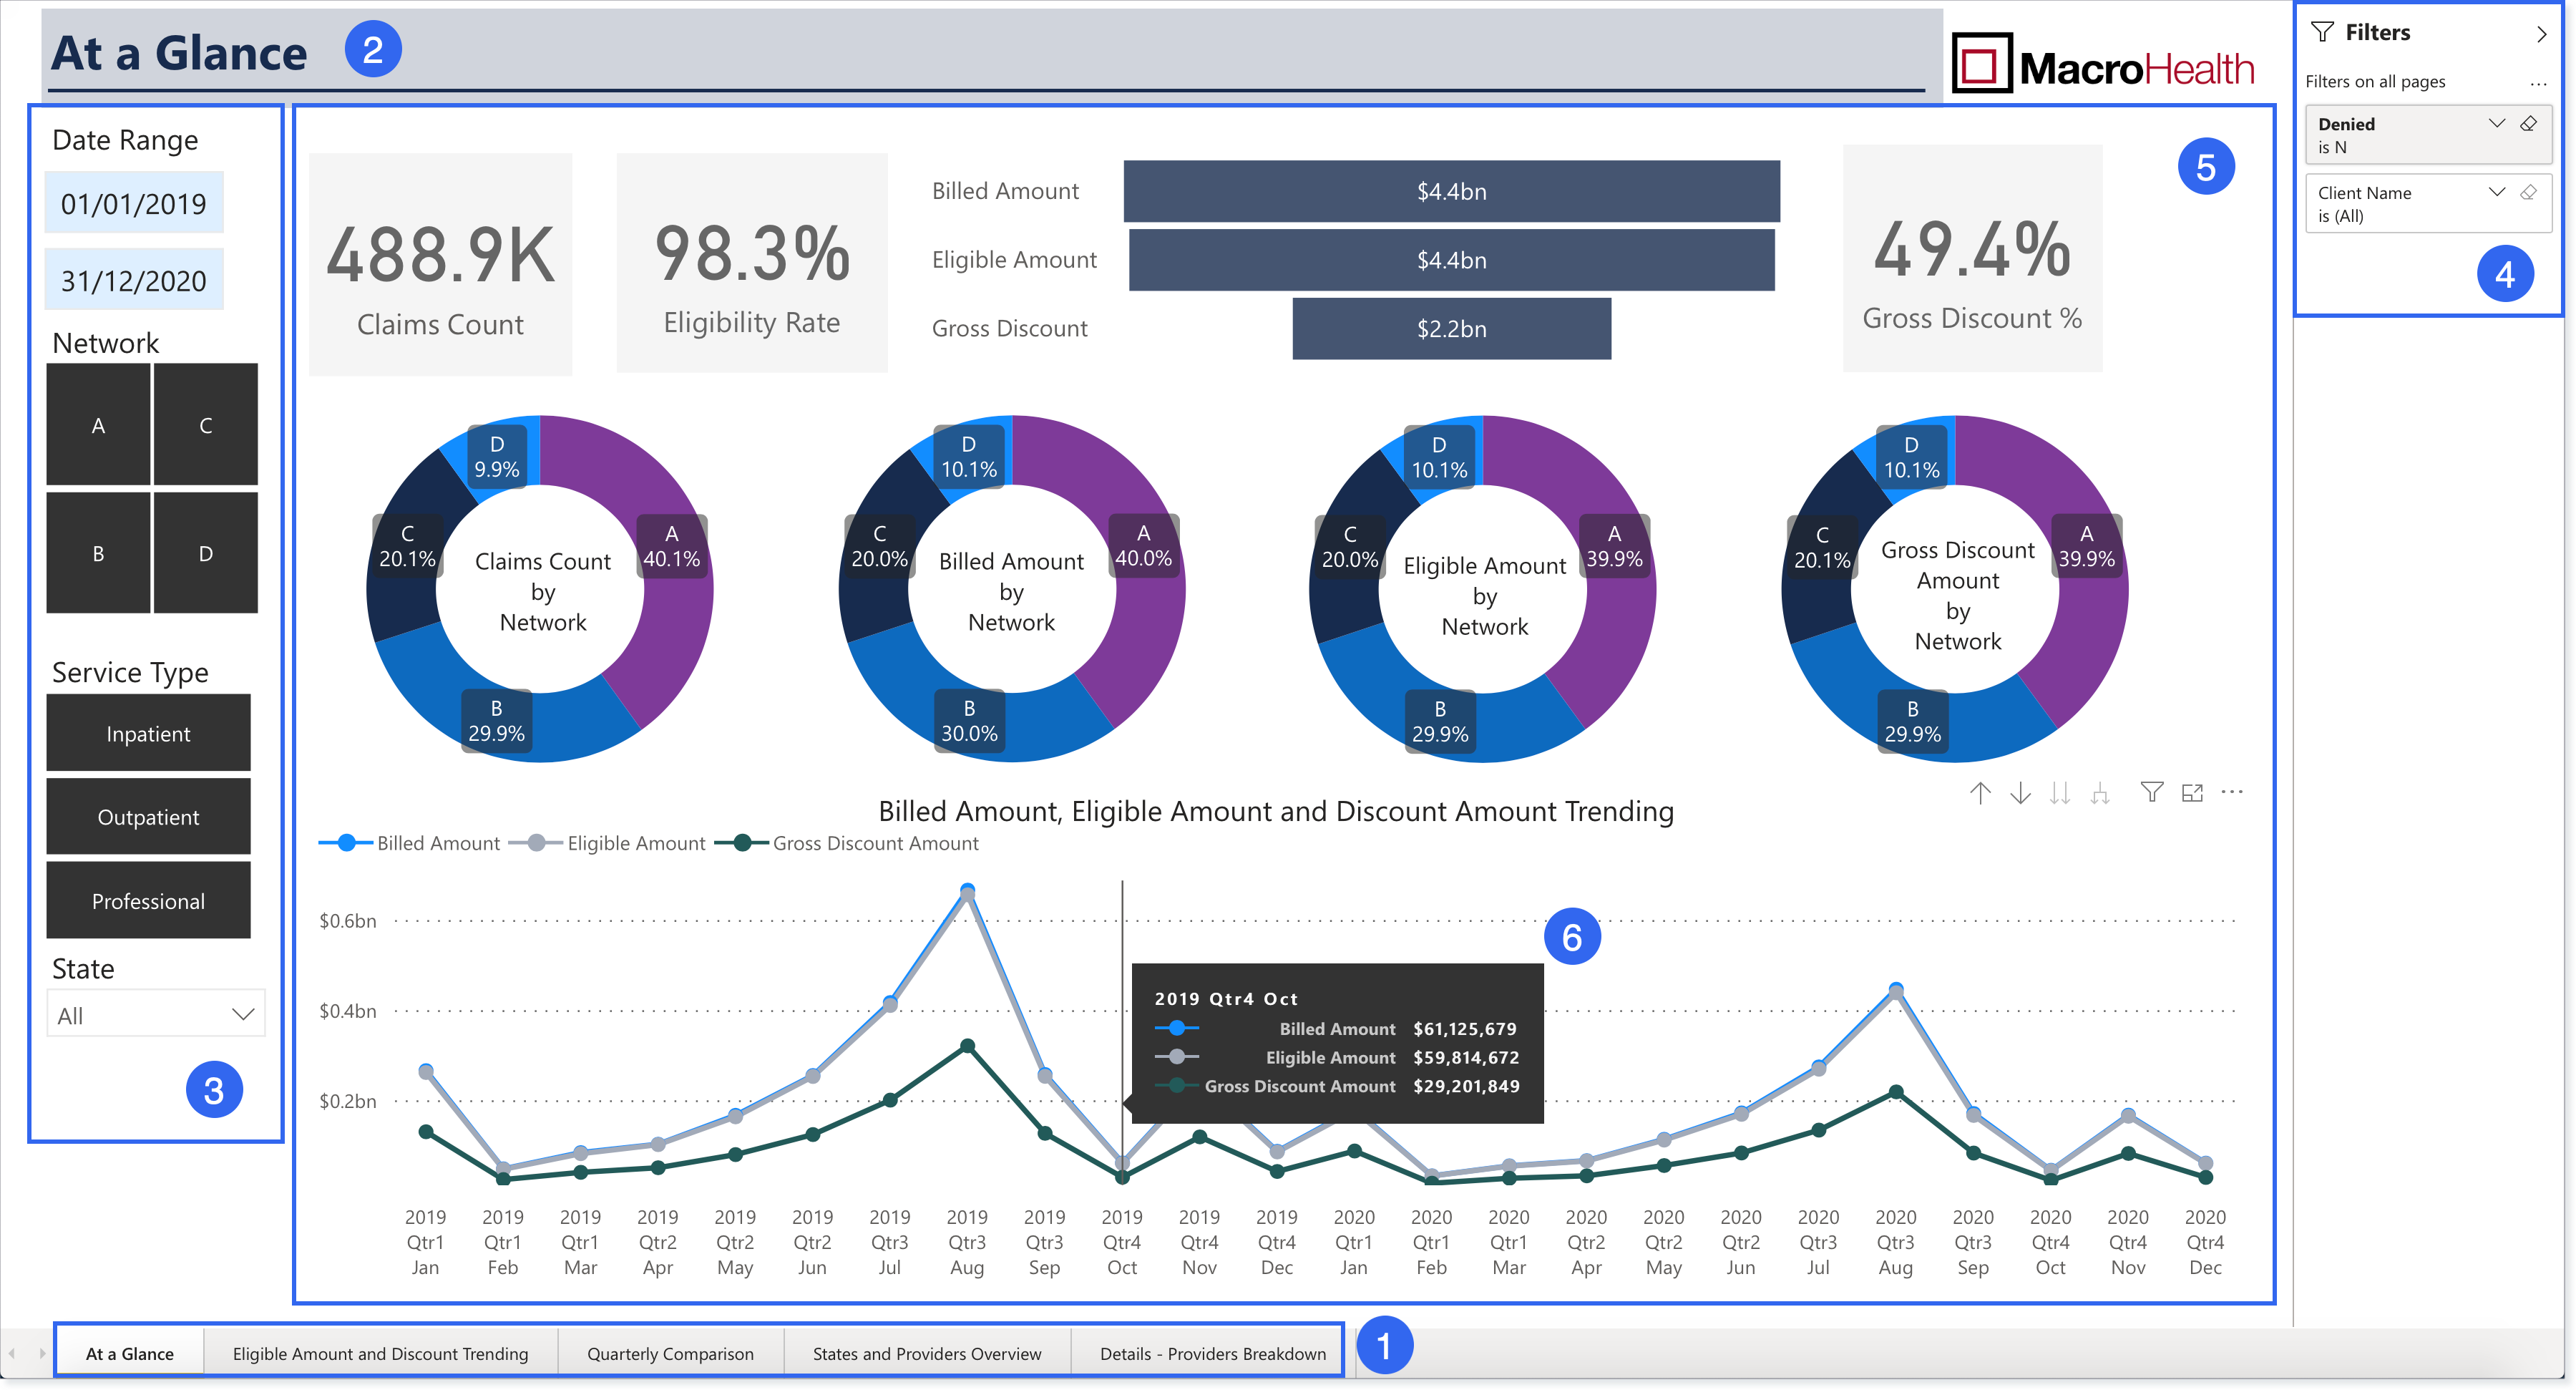
Report Navigation Menu: Choose what report to view by selecting one in the navigation menu.
Report Name: Displays the name of the report that is being viewed.
Left Side Filters: Allows refining data search based on Date, Network, Service Type, and State.
Right Side Filters: Permits refining data search by Client Name (only your company will appear) and by claims Denied (Yes or No values). Click the single arrow to collapse the Filters.
Report Viewer: Displays the data for the report, adjusted by the filters that were selected.
Hovering Dialog Box: Offers additional detailed information on the area that is hovered over.
Data Display
The reports display data using Bar Charts, Metrics Tables, Graphs, and a Heat Map. Clicking on them automatically updates to display data relating to the selected item.
Tooltips
Reports showing Metrics Tables or Charts allow changing the breakdown using Tooltips, which appear when hovering over any of the headers. The tooltips update the display when clicking in an area in the table or chart.

Tooltip | Name | Description |
|---|---|---|
| Drill up | Allows turning on/off the drill up and zooming up stepwise in the levels of the list |
| Drill down | Allows turning on/off the drill up and zooming down stepwise in the levels of the list |
| Next level hierarchy | Allows drilling down to the next level (not recommended because it combines levels in the graphs) |
| Expand hierarchy | Adds an additional level to the current view |
| Pin | Allows pinning the present visual to a new dashboard |
| Copy | Allows copying the image and pasting it in another platform along with the link to the Power BI report |
| Filter | Displays the filters that are currently effective in the report |
| Focus | Allows viewing each visual by itself in a new window. Once open, click Back to report to return to the initial window |


